In the past few months, Bitcoin (BTC) traders had grown used to less volatility, but historically, it’s not uncommon for the cryptocurrency to see price swings of 10% in just 2 or 3 days. The recent 11.4% correction from $29,340 to $25,980 between August 15 and August 18, took many by surprise and led to the largest liquidation since the FTX collapse in November 2022. But the question remains: was this correction significant in terms of the market structure?
Certain experts point to reduced liquidity as the reason for the recent spikes in volatility, but is this truly the case?
BTC surged 70%+ in 2023, yet the “Alameda gap” – liquidity dip post FTX and Alameda Research collapse – remains, supported by low volatility.
Read full analysis here: https://t.co/kVslgLQtpL pic.twitter.com/g8Ac7udBl7
— Kaiko (@KaikoData) August 17, 2023
As indicated by the Kaiko Data chart, the decline of 2% in the Bitcoin order book depth has mirrored the decrease in volatility. It’s possible that market makers adjusted their algorithms to align with the prevailing market conditions.
Hence, delving into the derivatives market to assess the impact of the drop to $26,000 seems reasonable. This examination aims to determine whether whales and market makers have become bearish or if they’re demanding higher premiums for protective hedge positions.
To begin, traders should identify similar instances in the recent past, and two events stand out:
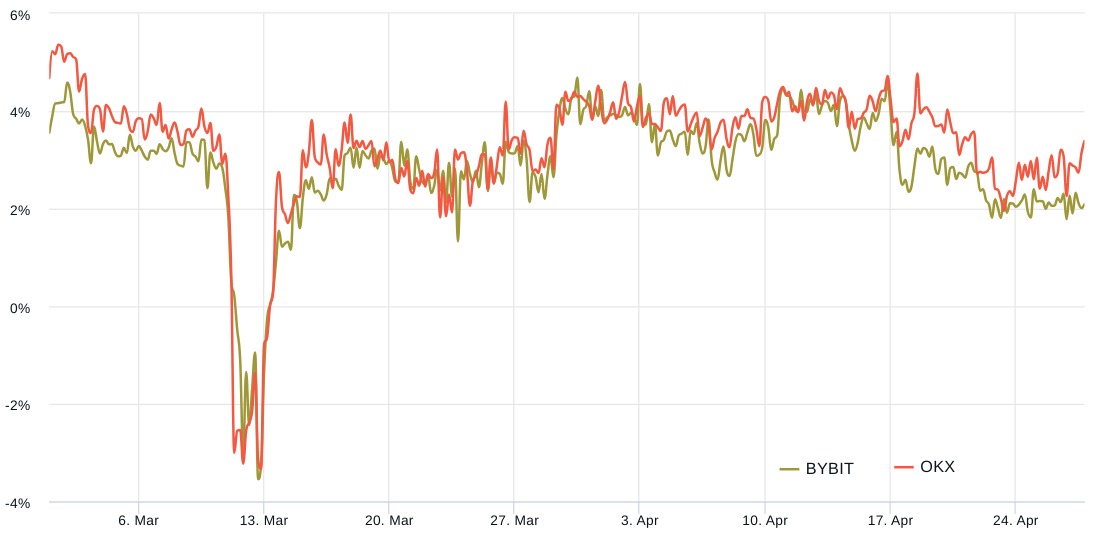
The first decline took place from March 8 to March 10, causing Bitcoin to plummet by 11.4% to $19,600, marking its lowest point in over 7 weeks. This correction followed the liquidation of Silvergate Bank, a crucial operational partner for multiple cryptocurrency firms.
The subsequent significant movement occurred between April 19 and April 21, resulting in a 10.4% drop in Bitcoin’s price. It revisited the $27,250 level for the first time in more than 3 weeks after Gary Gensler, the Chair of the U.S. Securities and Exchange Commission (SEC), addressed the House Financial Services Committee. Gensler’s statements provided little reassurance that the agency’s enforcement-driven regulatory efforts would cease.
Not every 10% Bitcoin price crash is the same
Bitcoin quarterly futures generally tend to trade with a slight premium when compared to spot markets. This reflects sellers’ inclination to receive additional compensation in return for delaying the settlement. Healthy markets usually display BTC futures contracts being traded with an annualized premium ranging from 5% to 10%. This situation, termed “contango,” is not unique to the cryptocurrency domain.

Leading up to the crash on March 8, Bitcoin’s futures premium was at 3.5%, indicating a moderate level of comfort. However, when Bitcoin’s price dipped below $20,000, there was an intensified sense of pessimism, causing the indicator to shift to a discount of 3.5%. This phenomenon, referred to as “backwardation,” is typical of bearish market conditions.
Conversely, the correction on April 19 had minimal impact on Bitcoin’s futures main metric, with the premium remaining around 3.5% as the BTC price revisited $27,250. This could imply that professional traders were either highly confident in the soundness of the market structure or were well-prepared for the 10.4% correction.
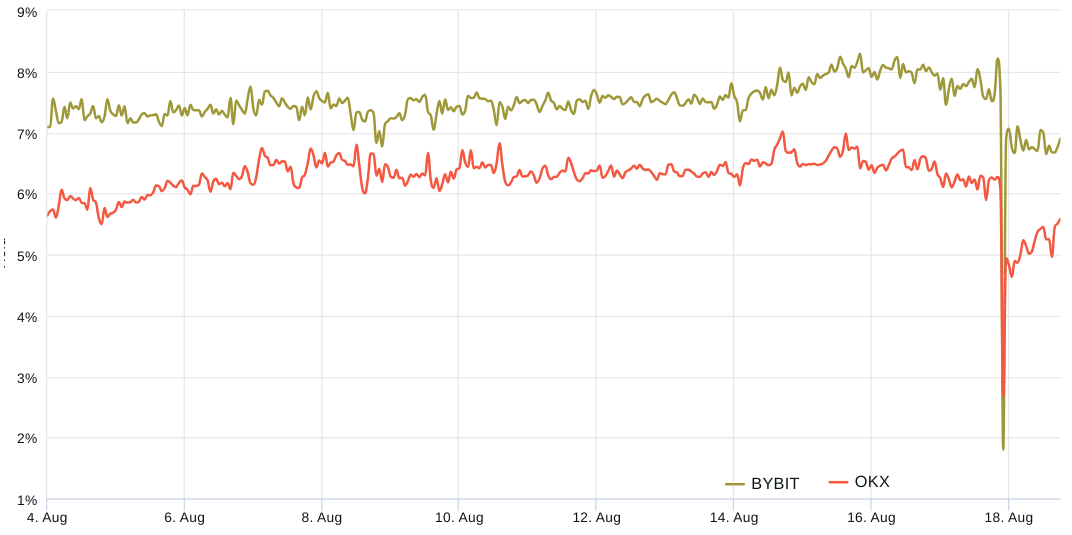
A comparison with the most recent event, the 11.4% BTC crash between August 15 and August 18, reveals distinct dissimilarities from previous instances. The starting point for Bitcoin’s futures premium was higher, surpassing the 5% neutral threshold.

Notice how rapidly the derivatives market absorbed the shock on August 18. The BTC futures premium swiftly returned to a 6% neutral-to-bullish position. This suggests that the decline to $26,000 did not significantly dampen the optimism of whales and market makers regarding the cryptocurrency.
Options markets confirm lack of bearish momentum
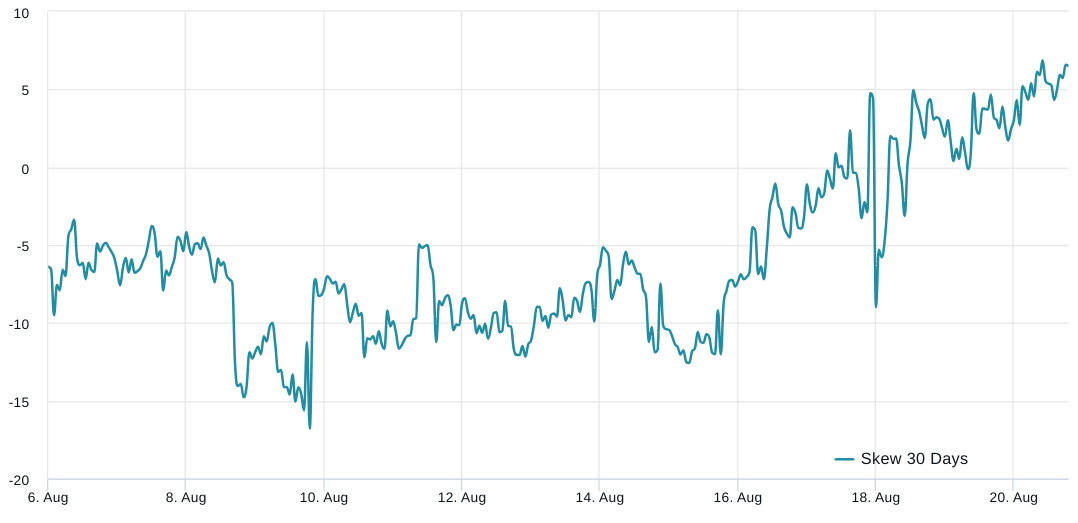
Traders should also analyze options markets to understand whether the recent correction has caused pro traders to become more risk-averse. In short, if traders anticipate a Bitcoin price drop, the delta skew metric will rise above 7%, and phases of excitement tend to have a negative 7% skew.
Related: Why is the crypto market down today?

Data indicate excessive demand for call (buy) BTC options ahead of the August 15 crash, with the indicator at -11%. This trend changed over the subsequent five days, though the metric remained within the neutral range and was unable to breach the 7% threshold.
Ultimately, both Bitcoin options and futures metrics reveal no signs of professional traders adopting a bearish stance. While this doesn’t necessarily guarantee a swift return of BTC to the $29,000 support level, it does reduce the likelihood of an extended price correction.
This article is for general information purposes and is not intended to be and should not be taken as legal or investment advice. The views, thoughts, and opinions expressed here are the author’s alone and do not necessarily reflect or represent the views and opinions of Cointelegraph.


